What is a cumulative flow diagram?
TweetA cumulative flow diagram is a type of chart used in project management to show the progress of a project. Cumulative flow diagrams serve a similar purpose to burn down or burn up charts, and can show a lot more information.
A cumulative flow diagram is made up of a series of lines or areas representing the amount of work in different stages of progression. For example, in software development, typical stages for development of a feature are:
- Not started
- Design
- Coding/Development
- Testing and QA
- Complete
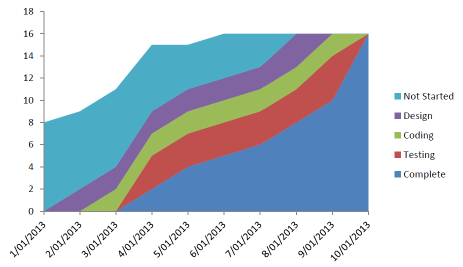
In a cumulative flow diagram, the number of features in each stage of development is plotted for each day in the chart.

An example of a cumulative flow diagram
Reading a Cumulative Flow Diagram
A cumulative flow diagram is confusing upon first inspection. However the key takeaways from the chart are the following:
- The project will be finished when the complete area merges with the not started area.
- The vertical height of each area shows how much work is currently in that stage. A vertical widening of a particular area shows a bottleneck in your development process that should be investigated in case corrective action is required.
- The horizontal distance from the not started line to the completed line is the projects lead time. The lead time is the average time from a feature request to a completed implementation.
When to use a Cumulative Flow Diagram
The ability to show bottlenecks in the development process is the key advantage of cumulative flow diagrams over burn up charts. This can be useful in planning corrective actions such as reassigning resources from development to testing to get project delivery back on schedule. Thus cumulative flow diagrams are very useful for the project manager and project team because they allow good project feedback and correction.
Creating a Cumulative Flow Diagram
Cumulative flow diagrams require a lot of data to create, so it is best to use software that already has access to this data to create them. JIRA Agile is able to display cumulative flow diagrams for your projects, and Intelligent Reports for JIRA is able to create Microsoft Word documents containing cumulative flow diagrams from JIRA data. Several other software project management systems are also able to display cumulative flow diagrams from their data.
Intelligent Reports for JIRA can automatically insert burndown charts into professional reports created from almost any aspect of your JIRA data. Intelligent Reports is the easy customizable reporting solution for JIRA, giving you complete knowledge of what is happening in your engineering team. In minutes you could have customized progress reports, timesheet reports, SLA reports and more delivered automatically to your email inbox. So if you use JIRA, what are you waiting for? Get a free 30 day trial from the Atlassian Marketplace today.
This article is part of a series on project progress charts. Articles in this series:
Tweet