Documentation
Getting started
Reports
Report templates
Administration
Step 4 – Tables of issues
Tables are great way to present lists of issues. Let's start with a table listing issues that are currently in progress in the selected project.
-
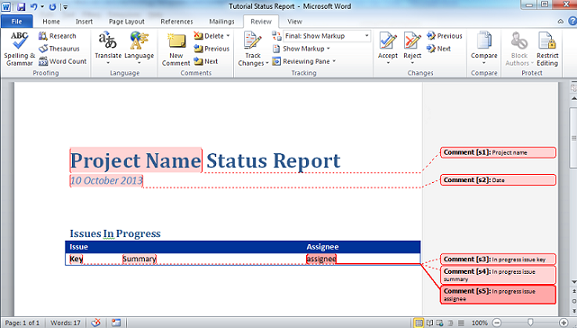
Open your template document in Microsoft Word and create a table with two rows, and however many columns you need. In this example we have created columns for the issue key, summary and assignee, but you can create columns for other data contained in the issue. Add your column titles, resize the columns and format the table any way you like.
In each cell of the second row type some text and create a comment around text you wish to replace with JIRA data.

-
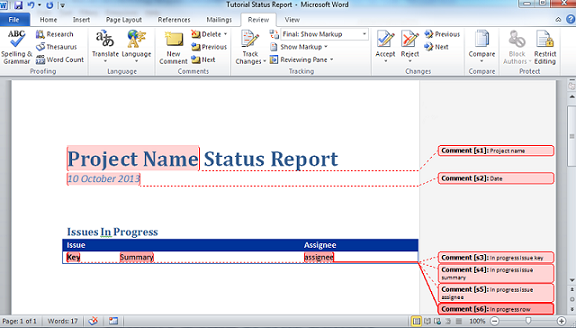
Now highlight the entire second row of the table and create a single comment covering the entire row. We will call this comment "In progress row" but you can call it whatever you like.

-
Save your document and upload it into Intelligent Reports the same way you did in step 3.
-
Create a new rule and give it a title.
We want Intelligent Reports to repeat the row of the table for each issue that is in progress in the project.
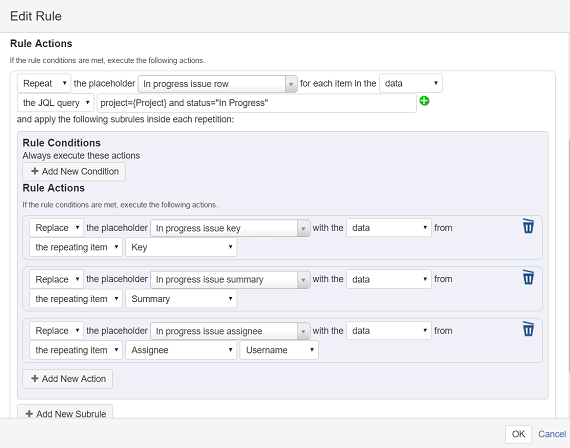
Choose Repeat as the action type. Type the name of your entire row comment in the placeholder section, in this example we called it "In progress row". Choose JQL query as the data source, and type the following JQL query:
Project = {Project} and status = "In Progress"The curly braces {} denote a part of the query that Intelligent Reports will replace before sending the query to JIRA. You can use it to specify the name of the question; Intelligent Reports will replace it with the value of the question, in this case the question called Project.
Now we will create three sub actions inside the repeat action to fill in the columns of our table. In each case we will select to replace the placeholder for the respective column with the appropriate data from the issue. When you have set this up it should look like the following:

Save the rule and you are done. You can choose a project and generate this report to see a table of in progress issues for that project.
You can also use this method to create other issue tables. For example to fill in the table with issues that are resolved but not yet closed, use this JQL query instead:
Project = {Project} and status = "Resolved"
Now let's make our report a little more impressive by adding a simple chart.
Next: Step 5 - Impress with a chart
Previous: Step 3 - Let's add data
Want to skip ahead or read it again?