Documentation
Getting started
Reports
Report templates
Administration
Adding a time based chart to your report
Time based charts, such as burn down and burn up charts need to be filled in with dates and values in one or more data series. The time based chart type provided by Intelligent Reports is best suited Microsoft Word column charts, line charts, bar charts, and area charts.
You can follow these steps to add a time based chart to your report:
-
Insert a column, line, bar or area chart into your Microsoft Word report template and use Microsoft Word to format it as required. Don't worry about the data values as these will be filled in by Intelligent reports.
-
Once you are happy with the look of your chart, add a comment to create a placeholder that covers your chart.

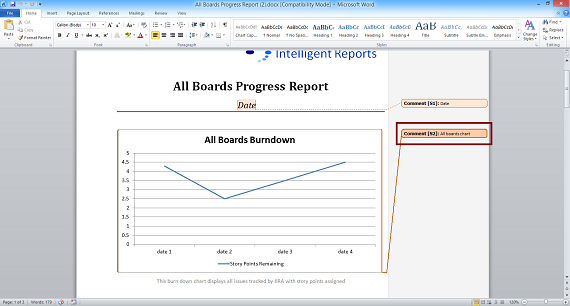
This example shows a burndown chart that has been created and formatted in Microsoft Word. The comment creating a placehoder called "All boards chart" covers the entire chart.
-
Upload your template file into Intelligent Reports.
-
Create a new rule to fill in the chart.
-
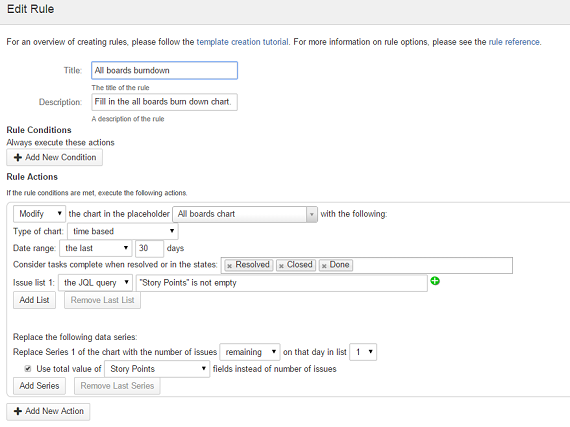
Select Modify from the list of actions and select the placeholder covering your chart. Select time based as the type of chart.

The above rule is filling in a burndown chart specified by the placeholder called "All boards chart".
You must also specify the date range that the chart should cover. There are four options:
- The last n days before the report is generated.
- All dates represented in the issue lists.
- Between two fixed dates or date question answers.
- Since a fixed date or date question answer until the date of report generation.
The time based chart asks you to select one or more lists of issues to base the data series on. Lists of issues must be a JQL query with optional list modifiers.
Lastly, you must specify the data for each series. Each series can represent the number of issues created on a day, resolved on a day, created on or before a day, resolved on or before a day, or remaining on a day in any of the issue lists.