Documentation
Getting started
Reports
Report templates
Administration
Adding charts to your reports
Intelligent Reports allows you to add any type of chart available in Microsoft Word including line charts, pie charts, area charts, bar graphs e.t.c. to your reports and have that chart filled in with your JIRA data.
Once you have chosen your chart, add it to your Microsoft Word report template document and format it as you require using Microsoft Word.

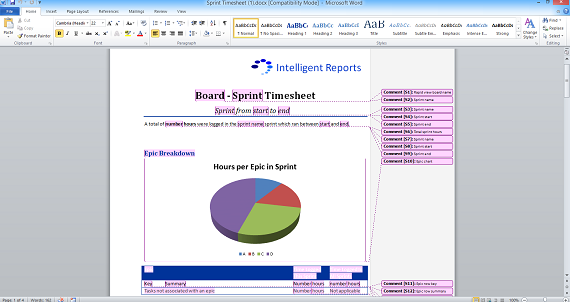
This example shows a pie chart which displays the hours in each epic for the chosen sprint.
You can follow the instructions for the type of chart that best matches the type of chart you are adding to your report:
-
Time based charts
Time based charts, such as burn down and burn up charts need to be filled in with dates and values in one or more data series. The time based chart type provided by Intelligent Reports is best suited Microsoft Word column charts, line charts, bar charts, and area charts. You can click here for instructions on how to add a time based chart to your report. -
Count based charts
Count based charts are ideal for comparison type charts such as pie or doughnut charts. Count based charts can be used to fill in the column names and data for charts with a single data series. You can click here for instructions on how to add a count based chart to your report. -
Calculated charts
Calculated charts allow you to use Intelligent Reports calculations to fill in the data for your chart. The simplest way to understand the calculated charts is to remember that you are specifying the rows and columns in the spreadsheet for your chart. Microsoft Word then interprets this data to draw the chart. You can click here for instructions on how to add a calculated chart to your report. -
Cumulative flow diagram
Cumulative flow diagrams are a type of chart that can be used to show the progress of a project. Cumulative flow diagrams work best with area charts in Microsoft Word but you can also use a line chart instead. You can click here for instructions on how to add a cumulative flow diagram to your report. -
Progress bar
You can use a progress bar to quickly show progress in an epic, sprint, project, issue etc. in a highly visual way. You can click here for instructions on how to add a progress bar to your report.