Documentation
Getting started
Reports
Report templates
Administration
Adding a cumulative flow diagram to your report
Cumulative flow diagrams are a type of chart that can be used to show the progress of a project. Cumulative flow diagrams work best with area charts in Microsoft Word but you can also use a line chart instead.
You can follow these steps to add a cumulative flow diagram to your report:
-
Insert an area chart or a line chart into your Microsoft Word report template and use Microsoft Word to format it as required. Don't worry about the data values as these will be filled in by Intelligent reports.
-
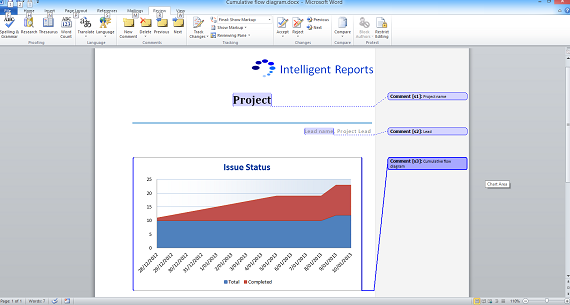
Once you are happy with the look of your cumulative flow diagram, add a comment to create a placeholder that covers your cumulative flow diagram.

This example shows a stacked area chart which will be used to display our cumulative flow diagram. The comment creating a placehoder called "Cumulative flow diagram" covers the entire cumulative flow diagram.
-
Upload your template file into Intelligent Reports.
-
Create a new rule to fill in the cumulative flow diagram.
-
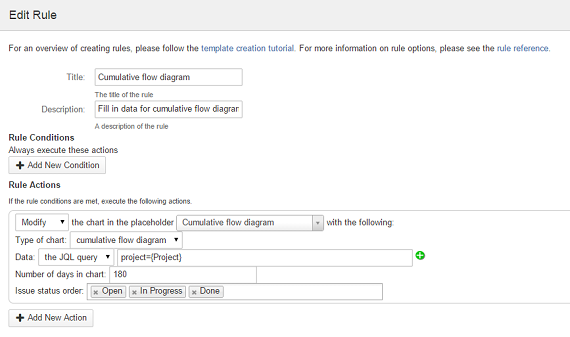
Select Modify from the list of actions and select the placeholder covering your cumulative flow diagram. Select cumulative flow diagram as the type of chart.

The above rule is filling in a cumulative flow diagram specified by the placeholder called "Cumulative flow diagram".
You will also need to specify the following items:
-
Data
This field is used to specify the source of your data to fill in your cumulative flow diagram. Specify a JQL query to select the issues that you would like represented in your cumulative flow diagram. In this example, we want every issue in the project selected by the user as the answer to the question called Project.project={Project} -
Number of days in chart
This field is used to specify the number of days for your cumulative flow diagram. In this example, we have selected 180 days. -
Issue status order
This field is used to specify issues status' you want displayed and the order in which to display them. Click to select the issues in the order you want them displayed.