Documentation
Getting started
Reports
Report templates
Administration
Adding a progress bar to your report
You can use a progress bar to quickly show progress in an epic, sprint, project, issue etc. in a highly visual way.
You can follow these steps to add a progress bar to your report:
-
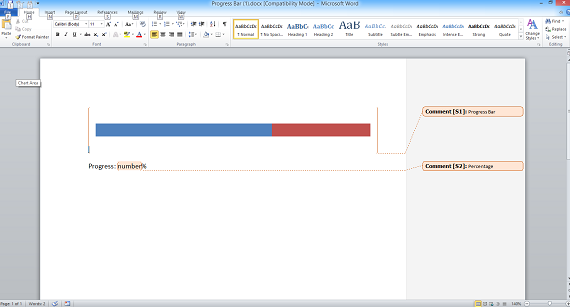
Insert a cumulative bar chart into your Microsoft Word report template and use Microsoft Word to format it as required. Don't worry about the data values as these will be filled in by Intelligent reports.
-
Once you are happy with the look of your progress bar, add a comment to create a placeholder that covers the progress bar.

This example shows a progress bar which is a bar chart with a single bar. The comment creating a placehoder called "Progress Bar" covers the progress bar.
-
Upload your template file into Intelligent Reports.
-
Create a new rule to fill in the chart.
-
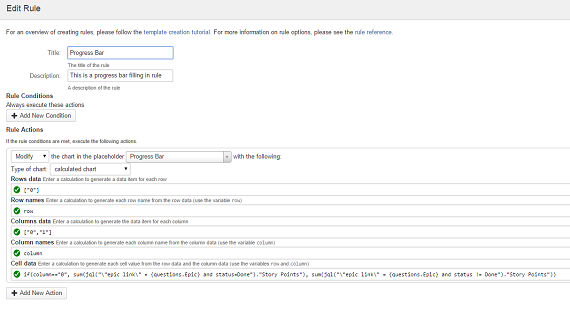
Select Modify from the list of actions and select the placeholder covering your progress bar. Select calculated chart as the type of chart.

The above rule is filling in the progress bar specified by the placeholder called "Progress Bar" with the percentage complete in the epic chosen by the user.
This example shows the percentage complete in the epic selected by the user as the answer to the question Epic.
You will need to fill in each of the following calculated items:
-
Row data
This calculation should return a list of objects which are the data for each row. In this case we do not need more than one row of data as we only have one bar in our bar chart:["0"] -
Row name
This calculation should return the actual text which is the name of each row. The variablerowholds the row data item for the current row, you should write a calculation to return the name of the row to put in the spreadsheet. As we do not want to name the row, and we are happy to use"0"as the row name we can simply typerow. Note that we could have also just typed"0":row -
Column data
This calculation should return a list of objects which are the data for each column. As our bar only has two segments, we will use an array with two values"0"and"1"which we will use to fill in the cell data below :["0", "1"] -
Column name
This calculation should return the actual text which is the name of each column. The variablecolumnholds the column data item for the current column, you should write a calculation to return the name of the column to put in the spreadsheet. As we do not want to name the column, similarly to row name, we can simply typecolumn:column -
Cell data
This calculation should return the value to put in each cell of the spreadsheet. The variablesrowandcolumnhold the row and column data for the current cell. You should write a calculation to take the current row and column and return the value to put in the cell. In this case we are using the if function to calculate the number of story points that are Done as the value of the first cell and not Done as the value of the second cell. Note that this template contains a question called Epic and we are using the answer to that question in the calculation below:if(column=="0", sum(jql("\"epic link\" = {questions.Epic} and status=Done")."Story Points"), sum(jql("\"epic link\" = {questions.Epic} and status != Done")."Story Points"))
You can click here to learn more about calculations.