Documentation
Getting started
Reports
Report templates
Administration
Step 5 – Impress with a chart
Everyone loves charts so we will insert a simple 14 day burn up chart to let the customer see the progress we have been making.
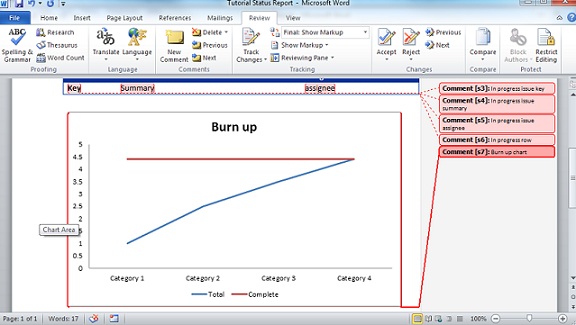
Open your Microsoft Word template document and insert a line chart. Edit the data to have two series, one named Total and the other named Complete. Don't worry about the actual data values as they will be filled in by Intelligent Reports.
Now format the chart in Microsoft Word, you can add labels, titles, change the colors, whatever you want really.
Highlight the entire chart, press the new comment button and give the comment a name, for example, Burn up chart.

Save the document and upload it to Intelligent Reports, the same way you did in steps 3 and 4.
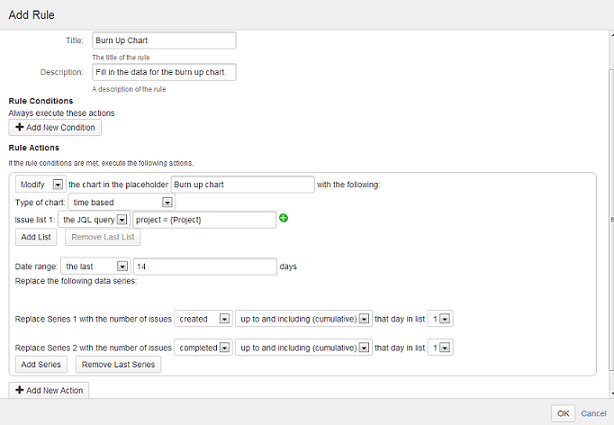
Create a new rule for the chart by clicking the Add Rule button.
We want to modify the existing chart, not replace it, so choose Modify from the drop down list. Type and select the placeholder name for your chart, in our example we called it Burn up chart. Now choose time based chart as your chart type. We only want the data for the last 14 days, so put 14 in the number of days box (you can put whatever number of days you want). The JQL query should be project={Project} to include all issues in the project.
We need two data series, the first should be the cumulative count of created issues (in other words the total number of issues in the project on that day), and the second should be the cumulative count of resolved issues (in other words the number of completed issues in the project on that day).

Save the rule and you are done. Generate a new copy of the report in JIRA and you will see a filled in burn up chart in your report.
Your first template
Now you have completed setting up your first report template. Your JIRA users can now create this report with a click of a button or have it scheduled so that the report will be emailed to them every week. The report will be delivered as a Microsoft Word document so you can review it, add notes, and/or convert it to PDF and send it to your clients.
Play around with the rules, you will find there is a lot of data available from JIRA and Intelligent Reports gives you countless intuitive ways to organize and utilize it. We hope you never have to waste time preparing another report again.
Keep in mind that you can also use Intelligent Reports for timesheets, support level agreement incident reports, service requests and many other types of reports. Take a look at our free template library for some examples. If you don't already have Intelligent Reports you can try it free for 30 days.